


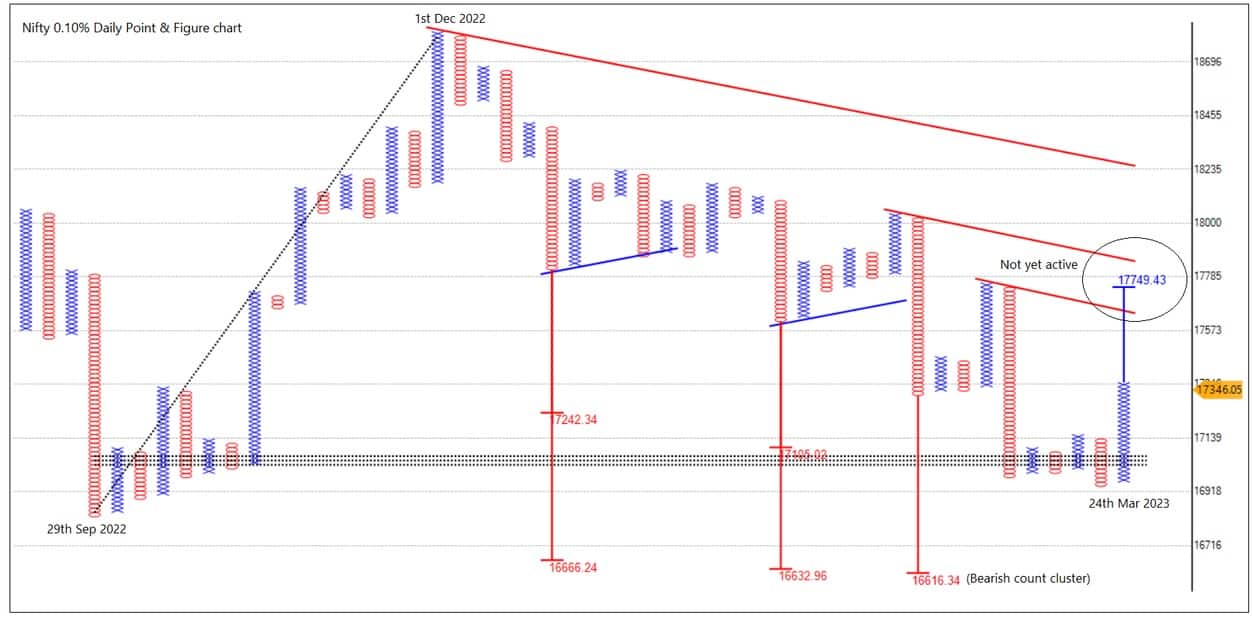
If we see a follow-through action to the current bounce, it will indicate an upside and activate bullish counts on point & figure (P&F) charts up to 17,800 – 18,000 on the Nifty50," Prashant Shah, Founder and CEO at Definedge Securities says in an interview to Moneycontrol.
However, he advises that some downside counts up to 16,500 are still open, so it would be prudent to be aware of the possibility if the price falls below 17,000.
Prashant, who is an author of four books on trading and investing, is looking for opportunities in the healthcare, pharmaceutical, defence, and banking sectors. "Some stocks in these sectors are looking good. These sectors are outperforming the major indices and showing a strong trend," he says.
After recent consolidation, the market started off April series on a strong note. Do you expect the strong rally in Nifty50 in April and do you expect it above 18,000 mark?17,000 appears to be a strong bottom based on a number of parameters. There is a good chance a consolidation from here.
The Nifty index has fallen by more than 2,000 points in the last four months. On an average, there were three major counter-trend or corrective (upside) moves of roughly 2.5 percent. Following these corrections, there was a supply and a subsequent decline.
The current upside trend is a fourth corrective move that has seen the same amount of upside so far. However, it has bounced from the previous demand area, indicating a strong bottom has been formed.
The number of stocks above the 200-day moving average in the Nifty50 has increased from 14 percent to 44 percent in the last 15 days. More than half of stocks are in column of ‘X’ (bullish swing) in P&F (point and figure) charts in the Nifty. These are initial bullish signs.
In terms of P&F, all previous moves were approximately 25 box moves, or 25 brick moves on the Renko chart. This is an average bounce so far. When the number of boxes in any corrective move exceeds the number of boxes in the price correction, I consider it a strong bounce.
The price action of all previous corrections lacked follow-through. If we see a follow-through action to the current bounce, it will indicate an upside and activate bullish counts on P&F charts up to 17,800 – 18,000.
The concern I have is that some downside counts up to 16,500 are still open, so it would be prudent to be aware of the possibility if price falls below 17,000. Trend is bearish until these bearish counts are negated and bullish counts are formed. It takes time but the trend is not established till then and a trader needs to be aware of it while deciding on strategies.
Nifty is still underperforming against other major asset classes such as Bonds, Currency and Gold. That picture has to change for a meaningful upside.
In terms of price movement, the Bank Nifty has been more or less in line with the Nifty50, both have corrected by 10-12 percent.
In fact, Bank Nifty is outperforming the market in the short term. It is interesting to note that all stocks in Bank Nifty are in the bullish column in the P&F chart which means bullish swings, whereas about half the stocks in Nifty are in bullish swings. That shows, more stocks have turned bullish in Bank Nifty.
The number of stocks participating in a trend is usually a leading indicator. Hence, I track breadth indicators closely.
Nevertheless, there are stiff resistances on the higher side, so there is also a possibility of short-term consolidation in Bank Nifty.
Why do you focus more on noiseless charts (Point and Figure) than other chart patterns available in the market?During the early stages of my career, I learned that if you want to succeed, you should not seek consensus in the market. The more people who agree with a view, the less comfortable you should feel in trading based on that view. You will not have an edge if you follow the same techniques as most others. This is when I began exploring lesser known methods in order to determine if there was an advantage to using them.
There were many techniques, indicators, and theories that I explored. When I stumbled upon the noiseless charts, I found them intriguing. It was not less than enlightenment for me when I began practicing it and understanding it better.
P&F, Renko, Line-break, Kagi are know as one-dimensional charts. These charts take only price into account and present it in a very different way. The reason I refer to them as noiseless charts is that they eliminate noise from the data. This helps you make your setup objective. They help you see hidden price patterns not clearly visible otherwise on the charts. These charts have unique properties that provide important information regarding trend and pattern.
Price analysis, indicators, and all strategies people follow in technical analysis are applicable to these charting methods as well. They make your studies more effective and noiseless. This can result in a significant increase in your trade productivity. It can be used in conjunction with any other study you are following. It is my sincere belief that those who have not learned about or understood these techniques are missing out on something valuable when it comes to trading.
Do you think the worst is over for Nifty IT especially after recent double bottom?As of yet, there is no significant evidence that the worst is over. Except that the stocks are trading at some important support levels. This is only a hope, there has been no confirmation as of yet. Many stocks in the index are still bearish.
Although the IT index relative strength chart has marked a higher bottom, it is still not bullish. This indicates that other sectors are doing better.
When a sector bounces from major support or forms a pattern like the bullish double bottom, the breakout in relative strength chart confirms the pattern. That's a very interesting tool to confirm a support pattern. Let's wait until that happens in IT.
Any strategy on Adani Group stocks that remained highly volatile for last couple of months?Adani Group stocks are high volatility stocks with large swings on both sides.
Traders who follow an objective strategy, have processes in place for entry and exit, and risk management, should keep an eye on stocks that have been in action and are in the news. There is usually a good risk-reward ratio in such cases, they can benefit from trading them.
Such stocks should not be traded by newcomers or traders who trade based on news or judgement as they will often end up making emotional trades in these situations.
Which are the top three sectors that you want to suggest for April month?I am looking for opportunities in the healthcare and pharmaceutical sectors, the defence sector, and the banking sector. Some stocks in these sectors are looking good. These sectors are outperforming the major indices and showing a strong trend. Finding leaders in the outperforming sectors is a good strategy that offers a favourable risk-reward ratio, if the trend of Nifty is not bearish. This later part is where many traders make mistake.
Disclaimer: The views and investment tips expressed by investment experts on Moneycontrol.com are their own and not those of the website or its management. Moneycontrol.com advises users to check with certified experts before taking any investment decisions.Discover the latest Business News, Sensex, and Nifty updates. Obtain Personal Finance insights, tax queries, and expert opinions on Moneycontrol or download the Moneycontrol App to stay updated!
Find the best of Al News in one place, specially curated for you every weekend.
Stay on top of the latest tech trends and biggest startup news.


